Papua New Guinea’s international trade
An overview of trade in Papua New Guinea, including its key imports and exports and major trading partners.
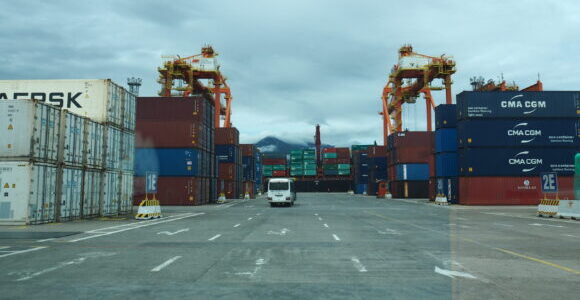
The South Pacific International Container Terminal in Lae handles around half of Papua New Guinea’s trade volumes. Credit: BAI
Papua New Guinea is a member of the World Trade Organization (WTO), Asia Pacific Economic Cooperation (APEC) and the Melanesian Spearhead Group (MSG). It has longstanding bilateral investment treaties with Australia, China, Germany, Japan and the United Kingdom, as well as an Economic Partnership Agreement with the European Union. It is also a signatory to the Pacific Island Countries Trade Agreement, a regional free trade agreement signed by members of the Pacific Islands Forum.
PNG recorded a current account surplus of K19.12 billion in 2024, or approximately 15 per cent of GDP, according to the Bank of Papua New Guinea. This marked the 11th consecutive year ending with a current account surplus. The last time PNG recorded a current account deficit was in 2013, when the deficit was 13.7 per cent of GDP, due mainly to large capital imports and service payments related to the construction of the PNG LNG project.
Exports
Papua New Guinea exported US$53.91 billion in goods in 2024, according to the Bank of Papua New Guinea.
PNG’s biggest exports are liquefied natural gas, gold, palm oil, cocoa, coffee, copper, nickel, marine products and crude oil.
The biggest export destinations in 2024 were Japan, US$10.99 billion (20.4 per cent of all exported goods), Australia US$10.29 billion (19.1 per cent), China, US$9.63 billion (17.9 per cent) and Singapore, US$7.94 billion (14.7 per cent).
Imports
Papua New Guinea imported US$19.36 billion in goods in 2024, according to the Bank of Papua New Guinea.
PNG’s biggest imports include manufactured goods, machinery and transport equipment, refined and crude petroleum, and food.
The main sources of imported goods in in 2024 were Australia US$8.42 billion (43 per cent of all imports), United States, US$3.51 billion (18 per cent), China, US$2.21 billion (11 per cent) and Singapore, US$1.64 billion (8 per cent).